Blog > Real Estate Market Report - Henderson, NV (Jan, 2024)
Current Market Condition
1,158
Active Listings
293
Pending Listings
$528,500
Median List Price
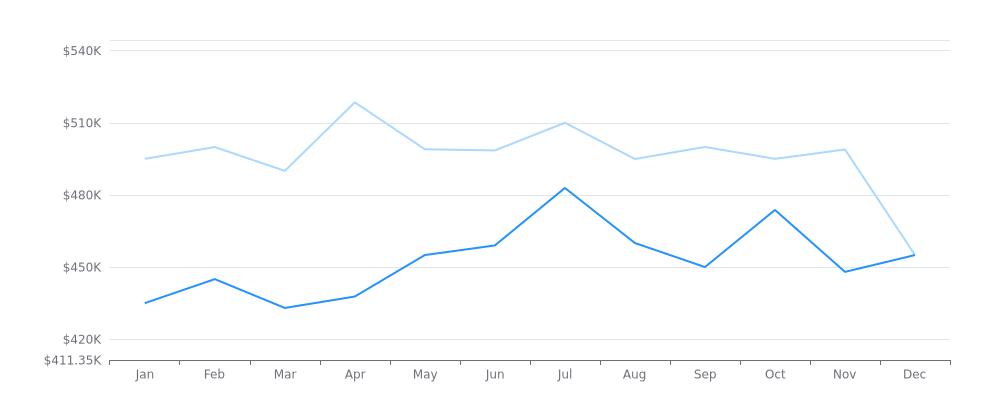
The median sale/list price for the first set of data (presumably for homes) starts at $495,000 in January 2023, peaks at $518,500 in April, and ends the year at $455,000 in December. The second set of data (presumably for condos) starts at $435,000 in January, peaks at $482,900 in July, and ends the year at $455,000 in December. Both sets of data show fluctuations throughout the year but end up at the same median price by the end of the year.
Median Sale/List Price
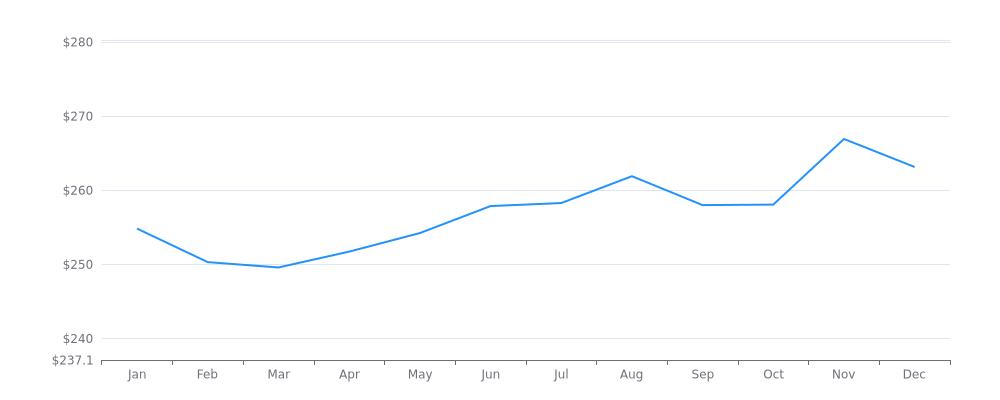
The median sale price per square foot has been on a gradual upward trend throughout 2023, starting at $254.819 in January and ending at $263.133 in December. The highest point was reached in November at $266.908. There were slight fluctuations, but overall the trend is positive.
Median Sale Price per Square Foot
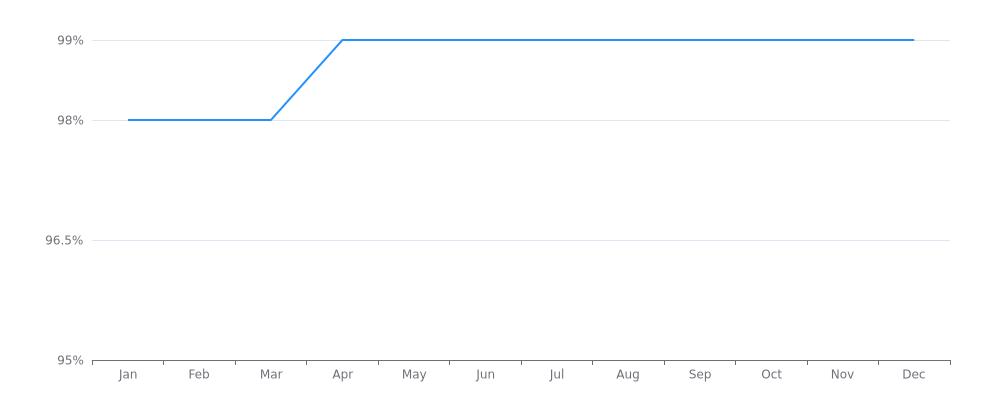
The median sale price to list price ratio shows a steady increase from January at 0.977 to June at 0.994, indicating that sale prices are closer to asking prices. However, there is a slight dip in August and September before stabilizing at 0.987 towards the end of the year.
Median Sale Price to List Price Ratio
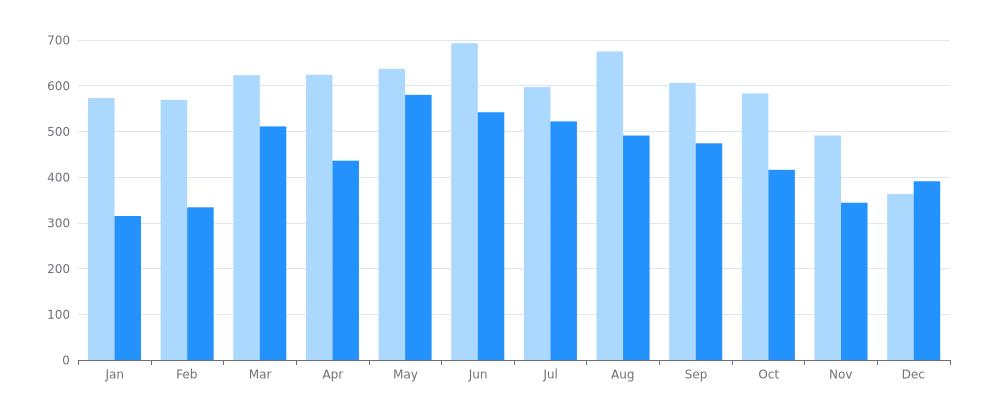
In 2023, the number of properties sold/listed ranged from 363 in December to 693 in June, with a total of 6,837 properties sold/listed throughout the year. The highest number of properties sold/listed in a single month occurred in May, with 637, while the lowest occurred in December, with only 363.
Properties Sold/Listed
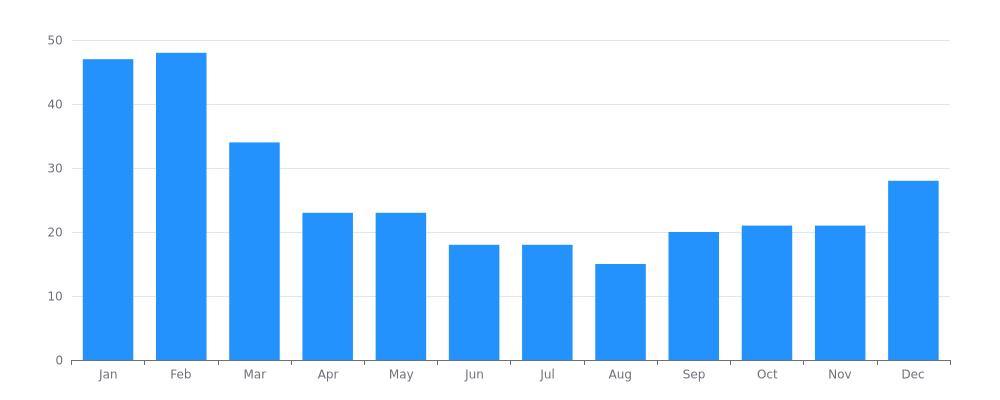
The median days on market for properties decreased steadily from January to August 2023, dropping from 47 to 15 days. There was a slight increase in September and October to 20 and 21 days, respectively, before stabilizing at 21 and 28 days in November and December.
Median Days on Market